Over the past few weeks, we have learned some interesting facts about the impact of the E-rate program on students across the country:
- The E-rate program directly affects over 52 million K-12 students.
- Almost one-third of the students in the country attend school at sites which qualify for an E-rate discount between 80% and 89%.
- While the annual funding cap has provided an average of $44 per student in E-rate benefits, Funding Year 2012 requests totaled $87 per student.
This leads to an interesting question: how is E-rate funding distributed among applicants at various discount levels? In Funding Year 2011, E-rate applicants at the 90% discount level received approximately $690 million in commitments – 20% more than applicants in the next highest discount band.
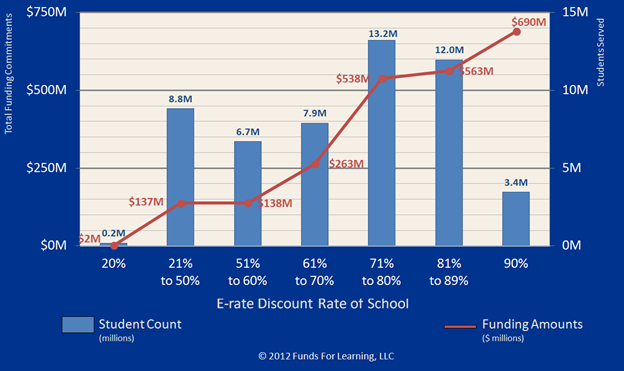
It is clear from the data that applicants at the 90% discount level request – and receive – significantly more E-rate funds than applicants at any other discount rate. In fact, in Funding Year 2011, schools at 90% were committed over three times as much funding as any other applicants.
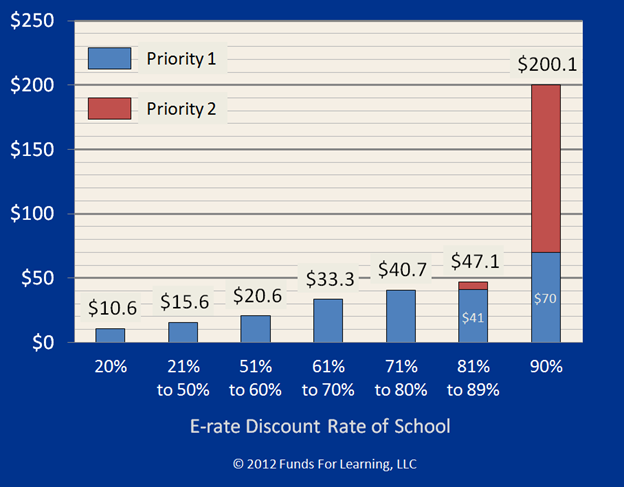
In Funding Year 2011, over $200 per student was committed for approximately 8% of the students in the country. 92% of the student population served by the E-rate program in Funding Year 2011 received $47.10 per student or less. While Priority 2 services comprise a majority of the FY2011 commitments at the 90% level, 90% applicants received almost 40% more Priority 1 funding than all applicants in the next highest discount band.
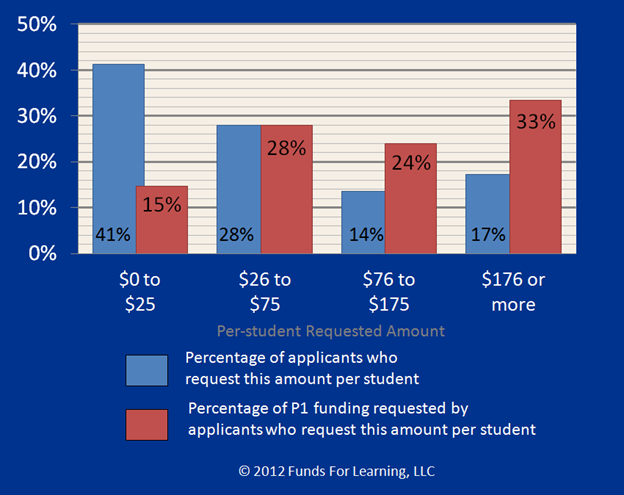
A further analysis of the data shows significant variations in the amount of funding requested per student. In Funding Year 2012, approximately 17% of the applicants in the country requested a total of $176 per student or more; however, that same group of applicants represents one-third of the total Priority 1 funds requested:
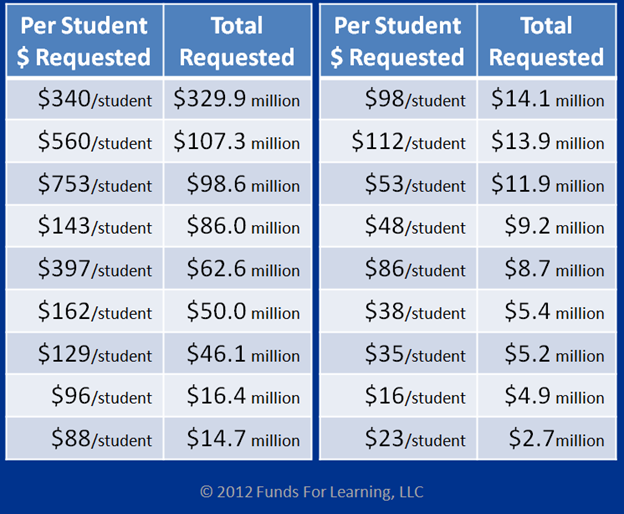
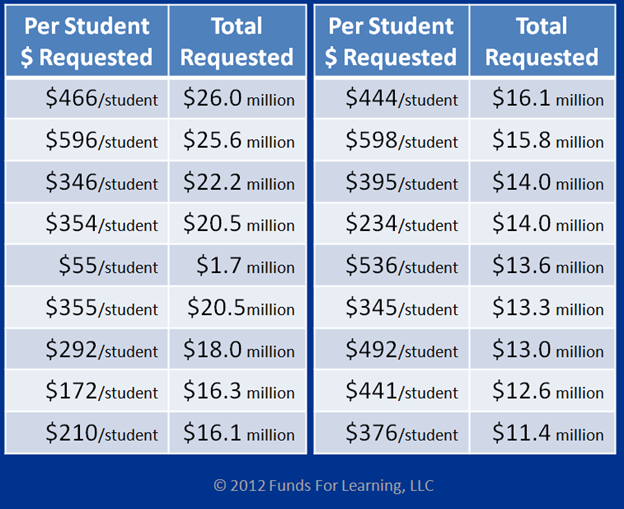
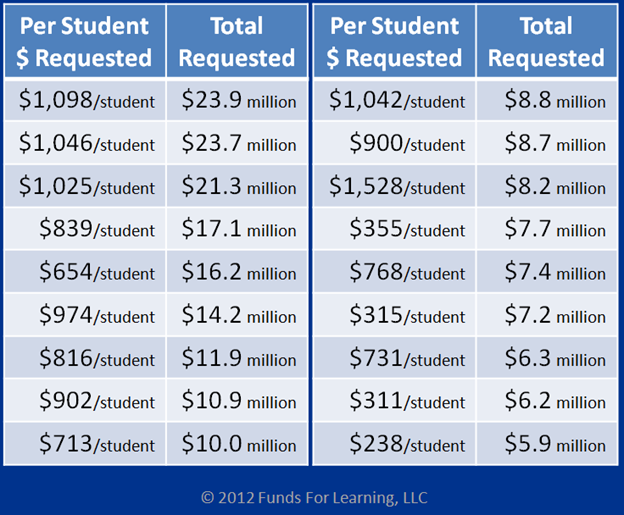
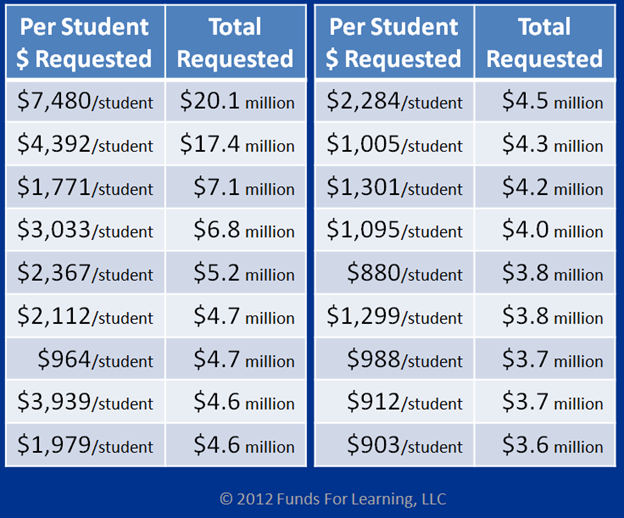
It is clear that applicants who submit high “per student” requests have a substantial impact on program demand. Requested amounts in FY2012 ranged from under $25 per student to over $7,400 per student. The following charts provide total requested amount and requests per student for the top 18 school districts in four size ranges:
In the absence of an increase in the annual funding cap, a more equitable distribution of funding per student will ultimately be required in order for the E-rate program to continue to have a direct, positive impact on over 95% of the students in the country.