

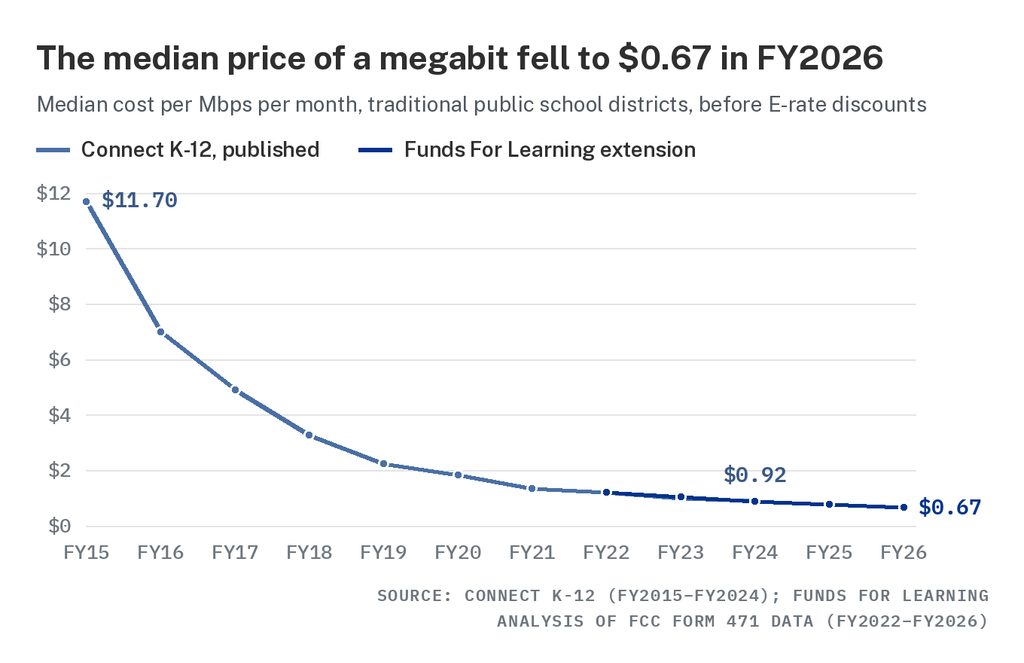
The median school district paid $0.67 per Mbps a month for Internet access in FY2026, down 45 percent since FY2022 and 94 percent since FY2015. Funds For Learning extended the cost measure from Connect K-12, the public website that tracked what school districts paid for Internet access, through FY2026 and found the decline still on pace. Prices hold while contracts run, and when a district’s price changes, it usually falls.
The decline hasn’t slowed
The nonprofit EducationSuperHighway built Connect K-12 to show what each school district paid for Internet access and how much bandwidth it bought, using districts’ E-rate applications. Its affordability measure is the median, across traditional public school districts, of what a district pays each month for Internet access divided by the megabits per second it buys. Cost is measured before the E-rate discount, so it’s the full price the district and the program pay together.
Connect K-12 is no longer being updated. Its published series runs from $11.70 per Mbps in FY2015 to $0.92 in FY2024. We applied its definitions to Form 471 applications for FY2022 through FY2026 to carry the series forward.
By our count, the median fell from $1.21 per Mbps in FY2022 to $1.05, $0.88, $0.76, and then $0.67 in FY2026. Each year’s drop has been about 12 to 17 percent.
Prices fell for high-cost and low-cost districts alike. The district at the 25th percentile paid $0.63 per Mbps in FY2022 and $0.33 in FY2026, while the district at the 75th percentile went from $2.49 to $1.25. In FY2022, 19 percent of districts paid less than 50 cents a megabit. By FY2026, 39 percent did. One district in ten still paid $2.50 or more per megabit in FY2026.
More bandwidth for a smaller bill
Median bandwidth doubled from 1,025 Mbps of Internet access in FY2022 to 2,000 Mbps by FY2023 and has held there, while the median monthly bill fell 11 percent, from $2,111 in FY2022 to $1,870 in FY2026. Each median is taken separately, so the bill divided by the bandwidth isn’t the median price. The share of districts at 1 Gbps or more rose from 77 percent to 89 percent, and the share at 10 Gbps or more went from 17.5 percent to 27.0 percent.
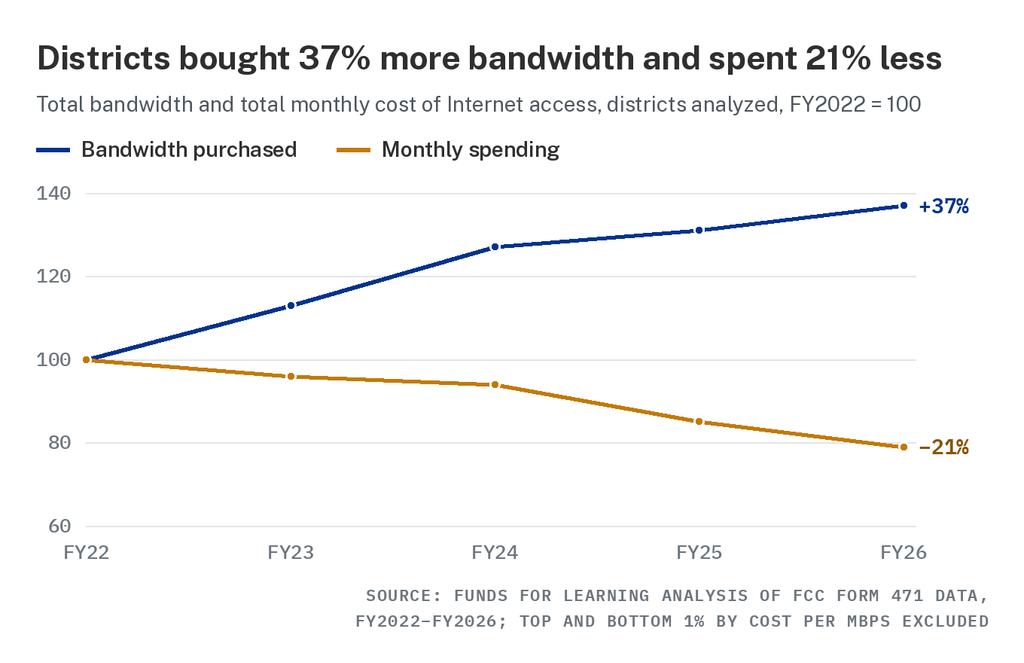
Across the districts in the analysis, total Internet bandwidth rose 37 percent between FY2022 and FY2026, and total monthly spending on it fell 21 percent. Those totals set aside the top and bottom 1 percent by price to keep data-entry errors out, and the FY2026 count includes about 4 percent fewer districts than FY2022’s.
| Measure | FY2022 | FY2026 |
|---|---|---|
| Median cost per Mbps | $1.21 | $0.67 |
| Median Internet bandwidth | 1,025 Mbps | 2,000 Mbps |
| Median monthly bill, before discount | $2,111 | $1,870 |
| Districts at 1 Gbps or more | 77% | 89% |
| Districts at 10 Gbps or more | 17.5% | 27.0% |
| Districts paying under $0.50 per Mbps | 19% | 39% |
The program-wide request data point the same way. In our 2026 E-rate Trends Report, FY2026 Category One requests totaled $2.14 billion before discounts as of April 15, 2026, 6.6 percent below FY2025 and the lowest in the eleven years we’ve charted. Part of the drop from FY2025 reflects the end of hotspot and school bus Wi-Fi eligibility. Over those eleven years, the number of sites listed for Category One service has stayed between 129,324 and 132,174. Because E-rate support is a percentage of cost, a lower price also lowers what the program pays.
Where the savings come from
In any given year, 56 to 61 percent of districts pay the same price per megabit they paid the year before, which is what multi-year contracts produce. Among the districts whose price did change, about three in four paid less, and the typical change was a drop of about 20 percent.
In our experience, that’s competitive bidding at work. A small district’s Form 470 is posted in the same place as a large district’s, and once it files its Form 471, the price it agreed to is public for the next district and the next bidder to see. FY2026 applicants filed requests with 3,616 different service providers across all E-rate services.
In our 2026 survey of 2,435 E-rate applicants, 78.6 percent agree that the competitive bidding process lowers their prices. That’s the highest since we started asking in 2016, when it was 44.7 percent.
Broadband has gotten cheaper across the economy. E-rate puts each new contract out to a public, nationwide bid, and the winning prices are published. Prices that hold through a contract and usually fall when they change are what we’d expect that process to produce. Among the 7,237 districts we could value in all five years, 76 percent pay less per megabit today than they did in FY2022.
How we extended Connect K-12’s measure
Before each release, Connect K-12 reviewed every district’s filings by hand, which took most of a year. We applied its definitions as fixed rules to Form 471 data as filed, without that review. For FY2022 through FY2024, the three years both series cover, our national figures land within five cents of its published medians. On the roughly 6,500 districts both methods value, two-thirds agree within 1 percent.
Our figures cover the 7,840 districts that bought Internet access on their own FY2026 applications. Districts served through state networks and consortia are in Connect K-12’s published figures but not in ours. Leaving them out pushes our median up, and the shared consortium costs our method can’t see push it down. For FY2022 through FY2024, the two effects net to within five cents. All figures reflect Internet access as requested on FCC Form 471, the same basis Connect K-12 used, and FY2026 figures reflect applications filed through September 2026. The full method, with its validation and limitations, is in the methodology section at the end of this article.
Funds For Learning worked on Connect K-12 with Connected Nation, maintaining its data platform and reviewing each year’s filings before release, so we have a stake in the measure being right.
Check your own price before your next Form 470
You can work out your own figure. Add up the pre-discount monthly cost of your Internet access lines, leaving out taxes, fees, and installation, and divide by the total megabits per second they deliver. Count a circuit and its separately billed Internet service once. One Massachusetts regional district, for example, lists three 500 Mbps circuits at $730 a month each and two 1 Gbps circuits at $128.13 each on its FY2026 application. That’s 3,500 Mbps for $2,446.26 a month, or $0.70 per Mbps, a little above the national median.
For what districts pay today, look at current filings. Every FY2026 Form 471 is on USAC’s Open Data site, and E-rate Manager® has them organized alongside every earlier funding year. Connect K-12 stops at FY2024, which makes it a good record of how far prices have come. If your Category One contract expires June 30, 2027, the FY2027 Form 470 you post in the coming months is where these savings show up. If you’d like a Guide to pull comparable prices for your district, let’s talk.
Methodology: how we calculated these figures
What it measures. Funds For Learning computed the median monthly cost per megabit per second (Mbps) of Internet access for the 12,911 traditional public school districts tracked by Connect K-12, the public school broadband website built by EducationSuperHighway, from FCC Form 471 line-item data for funding years 2022 through 2026. The median was $0.67 in FY2026 ($0.665 before rounding) and $0.76 in FY2025. Connect K-12 is no longer updated, and its published national series ends with FY2024; this method carries it forward.
Rules. The method applies Connect K-12’s definitions uniformly and without manual review.
Rule 1. Districts are Connect K-12’s in-universe traditional public school districts in the 50 states and DC. Every billed entity number maps to its district through Connect K-12’s FY2024 crosswalk, which is held fixed for FY2025 and FY2026.
Rule 2. Lines are Category One items whose purpose is Internet access, Internet access with no circuit, or a data connection to an Internet service provider. WAN circuits, applicant-owned fiber, consortium backbone, school bus service, and off-premises hotspot items are excluded.
Rule 3. Bandwidth is download speed in Mbps times quantity. Where ISP service and transport are billed separately, the lesser of the two bandwidths counts.
Rule 4. Monthly cost is the pre-discount eligible monthly recurring cost of broadband lines. Taxes, fees, installation, and maintenance are excluded. Where no recurring cost is reported, one-time cost is spread across the months of service.
Rule 5. District cost per Mbps is monthly cost divided by bandwidth, for districts with both above zero. The national figure is the median across districts. No outlier screen is applied.
| Funding year | FFL median | Connect K-12 published | Change from prior year (FFL, before rounding) | Districts valued (FFL) |
|---|---|---|---|---|
| FY2026 | $0.67 | Not published | −12.6% | 7,840 |
| FY2025 | $0.76 | Not published | −13.0% | 7,921 |
| FY2024 | $0.88 | $0.92 | −16.7% | 7,992 |
| FY2023 | $1.05 | $1.00 | −13.2% | 8,067 |
| FY2022 | $1.21 | $1.20 | 8,144 |
Validation. For FY2022 through FY2024, the method lands within $0.05 of Connect K-12’s published median each year (mean absolute error $0.035). On the 6,172 to 6,681 districts both methods value each year, 65 to 67 percent agree within 1 percent and 75 to 78 percent within 10 percent. Across 15 alternative rule sets, FY2025 stays between $0.74 and $0.80 and FY2026 between $0.65 and $0.70. A matched panel of the 7,237 districts valued in all five years has medians of $1.20, $1.04, $0.87, $0.76, and $0.67, so the decline isn’t a change in which districts are counted.
Limitations.
- About 2,500 districts a year buy Internet through a state network or consortium filing. Connect K-12 allocates those services to member districts; this method can’t, so those districts are excluded. Leaving them out pushes the median up, while the shared consortium ISP costs the method can’t see push it down; for FY2022 through FY2024 the two effects net to within $0.05.
- Figures are demand as filed on Form 471, not commitments, which is the basis Connect K-12 has always used.
- Applicant entries are taken as filed, without the review Connect K-12 performed before each release. The median absorbs most entry errors.
- FY2026 figures reflect applications filed through September 29, 2026, and late corrections could move them slightly.
- The method is not suited to state figures, because in several states nearly every district buys Internet through a state network.
Disclosure. Funds For Learning worked on Connect K-12 with Connected Nation, maintaining its data platform and reviewing each year’s filings before release.
Sources. Connect K-12 national figures, FY2015–FY2024 (FY2015 from the Connect K-12 FY2024 Results Report). FFL Form 471 line-item extracts, FY2022–FY2026; FY2026 file dated September 29, 2026. Connect K-12 database tables, read-only export of October 20, 2026. Category One request totals and survey figures: Funds For Learning, 2026 E-rate Trends Report (September 2026), filed in WC Docket Nos. 26-133, 13-184, 21-93, 21-455, and 26-173.
How to cite. Funds For Learning, “School Internet Now Costs 67 Cents a Megabit, Down 45 Percent Since FY2022” (October 28, 2026), fundsforlearning.com/news/school-internet-now-costs-67-cents-a-megabit/, methodology section.
QUESTIONS ABOUT THE ANALYSIS
John Harrington, Chief Executive Officer, Funds For Learning
jharrington@fundsforlearning.com